Port Congestion Isn’t Terminal Underinvestment—Drewry Exposes the Real Culprit Behind Global Vessel Delays
Drewry shipping consultants demolish Maersk’s underinvestment theory, revealing supply chain disruptions—not capacity shortfalls—are the true drivers of global port congestion and escalating vessel delays.
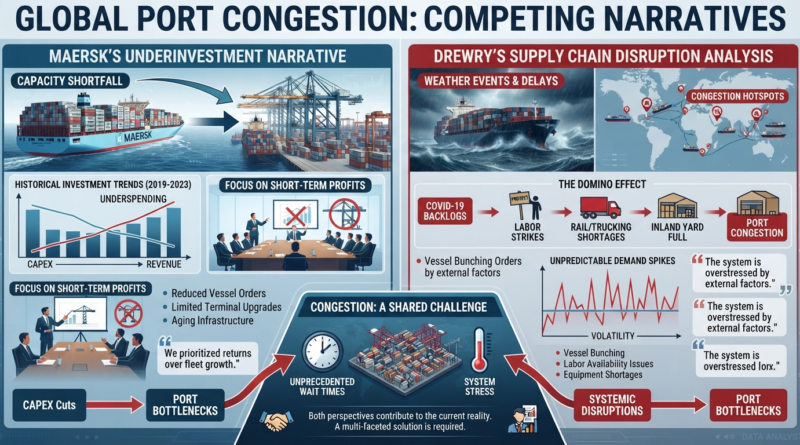
Drewry Rejects Maersk’s Terminal Underinvestment Claim: Supply Chain Disruption, Not Capacity Shortage, Is Driving Global Port Congestion
Maersk CEO Vincent Clerc made headlines earlier this month claiming that 15 years of insufficient terminal investment is causing port capacity constraints across Europe, South America’s east coast, West Africa, and the Middle East. The narrative was compelling: underinvestment in terminal infrastructure since the 2008 financial crisis has created a capacity deficit as Asian export volumes surge.
Drewry Shipping Consultants sharply rejected this thesis. Their latest Market Signals risk summary reveals the true culprit behind deteriorating port performance: supply chain disruptions are absorbing both terminal and vessel capacity, creating artificial congestion independent of actual terminal capacity constraints. Typhoons, tariffs, geopolitical tensions, port strikes, and vessel oversizing are combining to overwhelm ports operating at high utilization rates—regardless of how modern or newly invested their infrastructure may be.
The distinction matters profoundly for logistics professionals, shippers, and port operators. If congestion is fundamentally a terminal capacity problem, the solution is capital investment in new cranes, berths, and storage capacity. If congestion is a supply chain disruption problem, the solution is supply chain resilience, demand planning, and operational flexibility. Drewry’s analysis suggests the industry has been focused on the wrong problem.
The Maersk Underinvestment Narrative: Terminal Capacity as Scapegoat
Maersk CEO Vincent Clerc’s argument was straightforward: terminal capacity has failed to keep pace with containerized trade growth. Over the past 15 years, as Asian manufacturing and export volumes increased, port terminal investment lagged behind demand. The result is insufficient berth capacity, limited cargo handling equipment, and constrained storage area—creating bottlenecks when peak export seasons arrive.
Clerc specifically cited regions experiencing severe congestion:
- Europe — facing capacity constraints as vessel sizes increase and trade imbalances persist
- South America’s east coast — struggling with container volume growth and limited terminal expansion
- West Africa — operating at capacity limits with minimal expansion room
- Middle East — compressed by both regional export growth and transshipment demand
The narrative resonated because it appeared logical: trade growth + limited capital investment = capacity shortfall = congestion. Port operators and governments could point to needed infrastructure spending, shipping lines could justify rate increases due to “forced efficiency improvements,” and equipment manufacturers could tout new generation cranes and automation as solutions.
However, Drewry’s analysis reveals a more complex reality that makes the pure underinvestment argument incomplete.
Drewry’s Counter-Thesis: Supply Chain Disruptions, Not Capacity Deficit
Drewry Shipping Consultants’ Ports and Terminals Insight reveals that average waiting times and schedule reliability have deteriorated—but not uniformly due to insufficient capacity. Instead, external supply chain disruptions are creating cascading delays and queue buildup that overwhelm terminals regardless of their actual design capacity.
Drewry identifies multiple root causes of congestion independent of terminal infrastructure investment:
Typhoons and Weather Disruption: In week 32 (early August 2026), typhoons in Chinese origin ports caused ships to wait an average of 3.6 days for berth access. Tropical Storm Saudel was projected to strike the region from Ningbo to Fuzhou with wind speeds up to 95 mph, with Shanghai at the storm’s outer edge expecting significant disruption. This year’s El Niño is shaping up to be one of the most intense on record—an external factor wholly independent of terminal investment or capacity.
Tariff Disruption: Tariff volatility—particularly US-China trade tensions and potential return of tariff measures—creates unpredictable trade flow patterns. Shippers advance cargo movement to avoid tariffs, creating artificial demand spikes that compress port operations. No amount of terminal infrastructure investment can accommodate volatile, disruption-driven demand patterns.
Geopolitical Issues: Middle East disruption, regional conflicts, and changing shipping route patterns create congestion at unexpected ports while leaving capacity underutilized at others. These are supply chain routing problems, not terminal capacity problems.
Port Strikes and Labor Disputes: Labor actions temporarily disable terminal operations, creating queue backups that cascade through the global supply chain. Strike-induced congestion has nothing to do with long-term terminal capacity investment.
Terminal Overcapacity Paradox: The most damaging insight from Drewry: terminal operators have eliminated spare capacity to maximize returns on capital. Larger vessels increase volume peaks, but because terminal operators run at 85-90% utilization to meet financial targets, there is no recovery buffer when disruptions occur.
The Terminal Utilization Paradox: Why Efficiency Creates Fragility
Drewry’s analysis reveals a critical operational insight that explains congestion despite adequate infrastructure: terminal utilization rates have become so high that recovery time from disruptions is catastrophically extended.
When a terminal operates at 90% utilization, recovery from a single day’s disruption takes approximately one week. One day of weather delay, equipment breakdown, or labor action creates a seven-day cascade of queue backups, missed connections, and vessel delays.
Contrast this with terminals operating at 75% utilization: recovery from an equivalent one-day disruption requires only two days. The 15 percentage point difference in utilization translates to a 350% increase in disruption recovery time.
Drewry notes that “in normal years, the difference between those two operating points could be the difference between a competitive and an uncompetitive return on capital.” Terminal operators have consciously optimized for high utilization because:
- Capital costs require maximum throughput to achieve acceptable ROI
- Competition for terminal contracts incentivizes utilization metrics
- Financial markets reward efficiency and punish capacity slack
The paradox: by investing in terminal capacity and operating it at maximum efficiency (90%+ utilization), terminal operators have actually increased port fragility to disruption. A 75% utilization terminal with 15% spare capacity has the resilience to absorb disruption; a 90% utilization terminal has not.
Regional Vessel Delays: Escalating Disruption Cascade
Drewry’s data on regional average vessel delays reveals the scale of disruption-driven congestion:
West Africa — Most Severe Impact:
- 2025 average delays: 50 hours
- Current delays: 70+ hours
- Increase: 40% (+20 hours)
- Driver: Terminal congestion + vessel routing disruption + limited alternative ports
South Asia — Rapid Deterioration:
- 2023 low: ~35 hours
- Current: ~60 hours (approaching)
- Trajectory: Steady increase over three years
- Driver: Transshipment disruption + weather + geopolitical routing changes
China — Rising to Global Average:
- 2025: Under 30 hours
- Current: ~35 hours (global average)
- Trajectory: Converging with global norms as disruptions affect all major ports
- Driver: Typhoons + tariff uncertainty + vessel oversizing
Global Average: ~35 hours vessel delay, with trajectory rising
The crucial insight: these delays are not static capacity constraints. They reflect dynamic disruption cycles where weather, tariffs, and geopolitical events create temporary but cascading congestion that persists weeks after the initial disruption.
Container Rate Dynamics: Spot Rates Declining Despite Congestion
Surprisingly, despite escalating vessel delays and port congestion, spot rates on Drewry’s World Container Index have declined 1% in recent weeks—contradicting the narrative that constrained capacity should drive rate increases.
Rate Trend Analysis:
Intra-Asia Index (revealing divergence):
- Start of August: Under $1,000 per FEU
- Current: $1,200 per FEU
- Driver: Middle East disruption + poor weather forcing extended routing
- Specific lanes: Shanghai-Singapore and Shanghai-India showing major spot rate increases
- Implication: Disruption creates bottlenecks on specific lanes while capacity remains underutilized on others
World Container Index (overall trend declining):
- Down 1% in latest period
- European spot rates: Down 3% (fastest decline)
- Shanghai-New York rates: Down 2%
- Shanghai-Los Angeles rates: Flat
Interpretation: Declining overall rates despite rising delays suggests that demand on European and US markets is softening (markets have not recovered from early-2026 peak), offsetting rate increases from localized disruption. Shippers are experiencing delays but reduced demand dynamics are compressing rates—a classic indication of peak demand passing and market rebalancing.
Why the Drewry Analysis Matters for Supply Chain Strategy
The distinction between terminal underinvestment and supply chain disruption has critical strategic implications:
For Shippers and Forwarders:
- Underinvestment narrative suggests: Build inventory ahead, plan for capacity shortages, accept higher rates as structural
- Disruption narrative suggests: Improve demand planning to avoid peak periods, diversify ports, build supply chain resilience to weather/geopolitical events
- Action: Focus on supply chain flexibility, not capacity hedging
For Terminal Operators:
- Underinvestment narrative suggests: Capital investment in new capacity will solve congestion and justify rate increases
- Disruption narrative suggests: Current capacity is adequate; the problem is operational recovery from disruptions, not absolute capacity
- Action: Invest in operational flexibility, buffer capacity, and crisis management rather than pure volume expansion
For Logistics Providers:
- Underinvestment narrative suggests: Consolidate volume to largest ports with newest equipment
- Disruption narrative suggests: Diversify to multiple regional ports to avoid peak-period bottlenecks
- Action: Develop multi-port strategies with congestion hedges
For Policymakers & Port Authorities:
- Underinvestment narrative suggests: Fund terminal expansion projects to increase capacity
- Disruption narrative suggests: Invest in operational infrastructure (workforce training, equipment diversity, supply chain transparency) to improve resilience
- Action: Balance expansion with resilience-building
The Terminal Capacity Debate: Investment vs. Resilience
The Maersk underinvestment narrative isn’t entirely wrong—some regional ports do face genuine capacity constraints. However, Drewry’s analysis reveals that capacity alone is insufficient if terminals operate at utilization rates that eliminate disruption recovery buffer.
The real solution requires both:
1. Strategic Capacity Expansion in regions with genuine bottlenecks (certain Asian origin ports, specific US import gateways)
2. Operational Resilience Investment:
- Maintaining 20-25% buffer capacity rather than optimizing to 90% utilization
- Investing in diverse cargo handling equipment to provide operational flexibility
- Building supply chain visibility to anticipate disruption cascades
- Developing contingency routing protocols for geopolitical or weather disruptions
- Labor recruitment and training to provide workforce redundancy during strikes
The irony: a terminal that invests heavily in new cranes and berths but operates at maximum utilization offers no improvement in resilience. A terminal that maintains spare capacity while deploying smart management offers substantially better performance during disruption.
Forecast: Continued Disruption Cycles Through 2026-2027
Drewry’s analysis suggests vessel delays will remain elevated through the end of 2026 and into 2027 due to:
- Continued typhoon season in Asia (August-October 2026 intensity expected to remain high)
- Tariff uncertainty as trade policy debates continue (potential return of tariff measures in coming weeks)
- Geopolitical volatility in Middle East and Ukraine corridors
- Demand softening in US/Europe limiting opportunities for demand-driven capacity deployment
- Vessel cascades from recent months’ disruptions still working through global supply chain
The path to congestion resolution is not massive new terminal investment—it’s supply chain disruption management and strategic capacity buffering.
FAQ: Your Questions About Port Congestion, Terminal Capacity, and Vessel Delays
Q: Is port congestion really caused by terminal underinvestment? A: Not entirely. While some regions do face capacity constraints, Drewry’s analysis shows that most current congestion is driven by supply chain disruptions (typhoons, tariffs, geopolitical issues, strikes) overwhelming terminals operating at high utilization rates. Even well-equipped terminals struggle when operating at 90%+ utilization because they lack buffer capacity to absorb disruptions.
Q: Why do high-utilization terminals create longer recovery times? A: Terminals operating at 90% utilization take approximately one week to recover from a single day’s disruption. Those operating at 75% utilization recover in two days. The difference reflects queue theory: when a system is near maximum capacity, any disruption creates exponential queue growth. Spare capacity provides recovery buffer.
Q: What are the main drivers of current port congestion? A: Drewry identifies: typhoons and extreme weather (particularly this year’s intense El Niño); tariff volatility creating artificial demand spikes; geopolitical issues and routing disruptions; port strikes and labor actions; and vessel oversizing creating volume peaks that strain terminal operations. These are external supply chain disruptions, not capacity constraints.
Q: How severe is the current vessel delay situation? A: West Africa has seen delays increase from 50 hours (2025) to 70+ hours (current)—a 40% increase. South Asia is approaching 60 hours, up from 35 hours in 2023. China has increased from under 30 hours to approximately 35 hours (global average). Global average vessel delay is approximately 35 hours.
Q: Why are container spot rates declining despite port congestion and vessel delays? A: Demand on European and US markets is weakening following an early-2026 peak. While localized disruption creates rate increases on specific lanes (Shanghai-Singapore, Shanghai-India showing strong increases), overall declining demand is compressing global spot rates. The World Container Index is down 1%, European rates down 3%.
Q: Should shippers invest in advance inventory to hedge against port congestion? A: According to Drewry’s analysis, the better strategy is supply chain resilience—diversifying ports, improving demand planning to avoid peak periods, and building supply chain flexibility. Inventory hedges against capacity constraints; but since current congestion is disruption-driven (temporary), supply chain agility is more cost-effective than inventory buildup.
Q: Will new terminal capacity solve the congestion problem? A: Only if coupled with operational resilience strategy. A newly invested terminal operating at 90% utilization offers no improvement in disruption resilience. The solution requires both strategic capacity expansion in bottleneck regions AND operational capacity buffering to absorb disruptions.
Q: When will vessel delays normalize? A: Drewry expects continued elevated delays through end of 2026 and into 2027 due to: continued typhoon season intensity, ongoing tariff uncertainty, geopolitical volatility, and disruption cascades still working through the global supply chain. Resolution requires both demand stabilization and reduction in external disruptions.
Q: How should logistics providers adjust strategy based on Drewry’s analysis? A: Develop multi-port diversification strategies to avoid peak-period bottlenecks, improve supply chain visibility to anticipate disruption cascades, and build contingency routing protocols for geopolitical or weather disruptions. Focus on resilience rather than consolidation to largest ports.
Q: What’s the difference between terminal capacity constraints and supply chain disruption? A: Capacity constraints are structural (insufficient berths, cranes, storage); disruption effects are dynamic (weather, strikes, tariffs). Capacity constraints require infrastructure investment; disruption effects require operational resilience and supply chain planning. Confusing these two leads to misdirected investment.
Source Materials:
- Drewry Shipping Consultants: Market Signals Risk Summary (August 2026)
- Drewry Ports and Terminals Insight: Regional Vessel Delays and Port Congestion Analysis
- Drewry World Container Index: Spot Rate Trends and Regional Lane Performance
- Drewry Intra-Asia Index: Regional Rate Pressure from Middle East Disruption
- Insurance Journal: El Niño 2026 Intensity Projections and Typhoon Season Forecasts
- Maersk CEO Vincent Clerc: Terminal Underinvestment Claims (August 2026)
- Regional Vessel Delay Data: West Africa, South Asia, China Performance Metrics