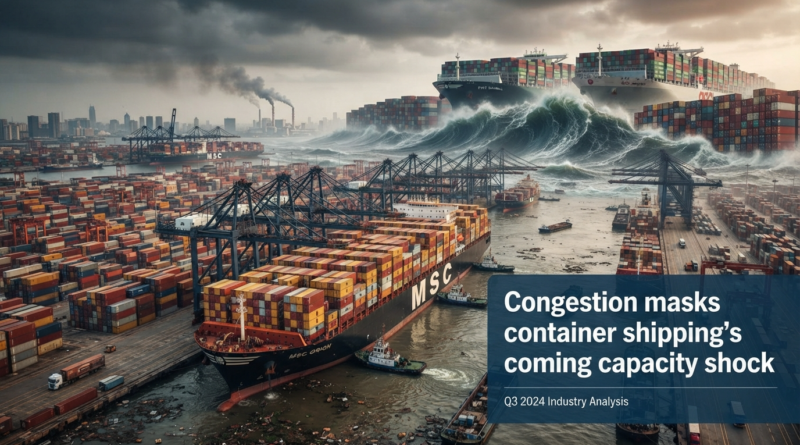
Port Congestion Is Hiding Container Shipping’s Capacity Time Bomb—6.6% of Global Fleet Sidelined Before Massive Newbuild Release
Sea-Intelligence data reveals that 2.3 million teu of containership capacity is currently absorbed by port delays—masking an approaching capacity crisis when Suez normalization and newbuilds flood the market simultaneously in 2027.
Container Shipping’s Perfect Storm: Port Congestion Masks 8.7% Capacity Contraction Headed for 2027
Port congestion is doing container shipping an enormous unintentional favor. By absorbing 2.3 million teu of vessel capacity—equivalent to the world’s sixth-largest carrier by fleet size—delays are preventing the industry from confronting a capacity crisis that could devastate rates and profitability through 2027.
Sea-Intelligence’s latest analysis reveals the scale of this hidden capacity problem. Global schedule reliability has collapsed 6.1 percentage points in July to 56.4%—the sharpest monthly decline since January 2021. Meanwhile, Suez Canal normalization is progressively returning services that were rerouted around the Cape of Good Hope, creating a two-front capacity shock: absorbed delay-capacity will eventually release back into the market precisely as massive newbuild orderbooks begin hitting water.
The timing is catastrophic. Sea-Intelligence calculates that a full Suez normalization would produce an 8.7% year-on-year contraction in global head-haul teu-mile demand during H1 2027—despite assuming underlying container demand growth of 6.6%. The containership orderbook already represents 40% of the existing fleet. When delayed capacity releases and newbuilds deploy simultaneously while Suez normalization reduces effective teu-mile demand, the industry faces a profitability crisis.
Port Congestion Reaches Pandemic Crisis Levels—And Growing Worse
The latest data from Sea-Intelligence and Linerlytica reveals port congestion has reached levels unseen outside the COVID-19 pandemic and Red Sea crisis aftermath.
Fleet Capacity Unavailability:
- Current: 6.6% of global containership fleet rendered effectively unavailable due to delays
- June 2026: 5.0% (already elevated)
- Pre-pandemic baseline: 2.2%
- Deterioration: 3x the pre-pandemic normal; up 1.6% in just 8 weeks
This means approximately 2.3 million teu of containership capacity is currently absorbed by port delays. To contextualize this: if this delayed capacity were a standalone carrier, it would rank as the world’s sixth-largest container line, marginally behind Hapag-Lloyd. The capacity is physically available but operationally unavailable due to queuing, making it invisible to the market yet consequential for fleet utilization.
Global Schedule Reliability Collapse:
- July 2026: 56.4%
- June 2026: 62.5%
- Monthly decline: -6.1 percentage points (sharpest since January 2021)
- Pre-pandemic normal: Approximately 85-90% schedule reliability
A 56.4% schedule reliability means that more than 43% of scheduled sailings are running late—a catastrophic degradation of service reliability that creates supply chain unpredictability for shippers.
Vessel Delay Severity:
- Average delay for late ships: 6.06 days behind schedule
- Context: This level is “largely unseen outside the pandemic and immediate aftermath of the Red Sea crisis”
- Impact: A 6-day delay creates cascading disruptions throughout shipper supply chains, forcing inventory accumulation, production delays, and retail stockouts
Containership Capacity Waiting to Berth:
- Current: 4.3 million teu waiting for berth access globally
- Significance: Surpasses the absolute COVID-era peak
- Implication: Congestion is now worse than pandemic-era chaos, even as underlying demand is substantially lower
Asia Crisis: Shanghai 21% Reliability, Regional Typhoons Cascading
Asia is at the epicenter of the congestion crisis, with all 14 of the region’s busiest ports recording deteriorating reliability in July 2026. Successive typhoons are compounding already-stretched terminal networks, creating a cascade of delays that extends across the entire region.
Regional Schedule Reliability (July 2026):
Shanghai — Most Severe Impact:
- Schedule reliability: 21%
- Implication: Only 1 in 5 scheduled sailings departed on time
- Driver: Typhoons + dense vessel arrivals + terminal congestion
- Strategic importance: World’s largest container port; delays here cascade through entire global network
Ningbo — Severe Deterioration:
- Schedule reliability: 34.6%
- Implication: Two-thirds of sailings running late
- Driver: Typhoon disruption + proximity to Shanghai causing cascading delays
- Capacity impact: Ningbo handles 4.7M teu annually; delays here affect Asia-Europe routes
Singapore — Moderate but Worsening:
- Schedule reliability: 43.2%
- Implication: Slightly better than Shanghai/Ningbo but significantly below pre-pandemic norms
- Strategic importance: Critical transshipment hub; delays here disrupt global trade routes
- Challenge: Vessel queuing creating berth bottlenecks despite modern terminal infrastructure
Asia-Wide Impact: Typhoons are compounding the reliability collapse. El Niño intensity in 2026 is among the strongest on record, creating consecutive typhoon events that overwhelm even modern Asian terminal networks. Rather than isolated disruption events, terminals are facing sustained waves of disruption with insufficient recovery time between events.
The cascade effect: when Shanghai delays ships 6+ days, those delayed vessels create compression at downstream ports (Singapore, Port Klang, Kaohsiung), which then delays Asia-Europe transshipment connections, which then delays trans-Pacific and Asia-Americas services. A localized typhoon disruption in Shanghai becomes a global supply chain cascade within days.
The Capacity Release Timeline: Congestion Could Unwind Rapidly—Or Persist
Sea-Intelligence models suggest the current disruption cycle could unwind on two different timelines, depending on how quickly port operations normalize:
Aggressive Normalization Scenario (2-3.5 months):
- Timeline: By October-November 2026
- Path to normalization: Typhoon season subsides + ports implement surge capacity + vessels space sailings
- Result: Return to end-2025 delay levels
- Implication: 2.3m teu currently absorbed by delays rapidly releases back into market
Conservative Normalization Scenario (4.5-6 months):
- Timeline: By December 2026-January 2027
- Path to normalization: Slow gradual recovery as weather stabilizes and terminal efficiency improves
- Result: Return to June 2025 lows (healthier vessel utilization)
- Implication: 2.3m teu remains absorbed through Q4 2026, with gradual release Q1 2027
The Critical Risk: Regardless of timeline, the absorbed capacity will release. When it does, the market will experience a sudden 2.3 million teu surge in available capacity precisely as newbuilds begin entering service and Suez normalization reduces effective demand.
Suez Canal Normalization: The Larger Capacity Release
While 2.3 million teu of delayed capacity is significant, a much larger capacity release is unfolding simultaneously: Suez Canal normalization.
The Suez Shift:
- Current status: Approximately 19% of Asia-Europe capacity has returned from Cape route to Suez Canal
- Companies shifting: MSC, Maersk, CMA CGM, and others progressively returning services to normalized routing
- Implication: Routes that take Cape routing are approximately 12-14 days longer than Suez routing
When vessels shift from Cape routing to Suez routing, they effectively reduce the number of round trips required to maintain equivalent capacity deployment. A 12-14 day savings per round trip means fewer vessels are needed to maintain the same service frequency.
Capacity Mathematics of Suez Normalization:
Full Suez Normalization Impact (all Asia-Europe capacity returns to Suez):
- 2027 H1 forecasted impact: 8.7% year-on-year contraction in global head-haul teu-mile demand
- Assumption: Underlying container demand growth 6.6% (healthy organic growth)
- Result: Despite 6.6% volume growth, teu-mile demand contracts 8.7% due to reduced effective capacity requirement
This paradox reveals the power of route efficiency: even with container volume growing 6.6%, the total ton-miles (teu × distance) decline 8.7% because vessels travel shorter distances.
50% Suez Return Scenario:
- Partial normalization (only half of Asia-Europe capacity returns to Suez)
- Impact: Pushes teu-mile demand growth into negative territory
- Combined with 6.6% volume growth: Negative teu-mile demand despite volume growth
Containership Orderbook Risk: The orderbook represents approximately 40% of the existing fleet. This means the industry has ordered enough new tonnage to add 40% capacity to the market. When these newbuilds enter service from 2026-2028, combined with Suez normalization reducing effective demand, the industry will experience a capacity surplus that could compress rates significantly.
The Perfect Storm: Three Capacity Shocks Converge in 2027
Shock #1 — Delayed Capacity Release (Q4 2026-Q1 2027):
- 2.3 million teu of currently absorbed delay-capacity releases back into market
- Timeline: 2-6 months as congestion normalizes
- Impact: Sudden surge of available capacity
Shock #2 — Suez Normalization (Progressive H1 2027):
- 19-100% of Asia-Europe capacity returns to Suez routing
- Effect: Reduces effective teu-mile demand despite volume growth
- Impact: Up to 8.7% contraction in head-haul demand metrics
Shock #3 — Newbuild Orderbook Entry (2026-2028):
- 40% of existing fleet ordered; progressive delivery 2026-2028
- Effect: Massive tonnage addition to existing capacity
- Impact: Supply-demand imbalance if demand growth doesn’t match capacity growth
Combined Impact on Profitability: When all three shocks converge, the container shipping industry faces potential rate collapse reminiscent of 2015-2016 when massive orderbook entries flooded the market. Carriers invested in expensive newbuilds only to face depressed rates and negative returns.
Why Port Congestion Is Actually Container Shipping’s Temporary Blessing
This analysis reveals a grim reality: port congestion is inadvertently preventing container shipping industry collapse in 2026-2027.
By absorbing 2.3 million teu of capacity, delays are effectively throttling the industry’s supply. When 6.6% of the global fleet is idle due to queuing and delays, it’s equivalent to taking 2.3 million teu permanently out of service. This reduction in effective supply is temporarily supporting rates and vessel utilization.
When congestion normalizes:
- 2.3 million teu re-enters service simultaneously
- Suez normalization reduces effective route demand
- Newbuilds hit the water as capacity is released
The industry faces a profitability cliff. Carriers will be forced to:
- Cut rates to deploy delayed and new capacity
- Blank sailings to match reduced effective demand
- Reduce voyage profitability to maintain market share
- Defer further newbuild deliveries to manage oversupply
Shipping cycles are predictable:
- Demand growth → Rate increases → Newbuild orders
- Newbuilds delivered → Capacity surplus → Rate collapse
- Rate collapse → Orderbook freezes → Capacity reduction
- Capacity reduction → Demand recovery → New cycle begins
The industry is heading for stage 2-3 transition.
What This Means for Logistics, Shippers, and Supply Chain Professionals
For Freight Forwarders and Non-Vessel Operating Common Carriers (NVOCCs):
- Current environment: Lock in forward contracts before congestion normalizes and capacity floods market
- 2027 risk: Rates may collapse 20-40% as delayed capacity releases and newbuilds enter service
- Strategy: Build customer relationships through congestion crisis; prepare for rate compression
For Shippers and Retailers:
- Current environment: Expect continued delays and schedule unreliability through Q4 2026
- 2027 opportunity: Rates likely to decline; negotiate long-term contracts for 2027-2028 at lower levels
- Strategy: Use current congestion to renegotiate contracts with leverage; prepare for improved reliability 2027
For Contract Manufacturers and Supply Chain Managers:
- Current crisis: Delays averaging 6+ days; build safety stock for critical components
- 2027 transition: As congestion normalizes, schedule reliability improves dramatically
- Strategy: Reduce safety stock buffers gradually as reliability improves; optimize inventory
For Carriers and Shipowners:
- Current advantage: Congestion keeping rates elevated; utilize profitability to de-lever balance sheets
- 2027-2028 challenge: Prepare for rate compression from capacity oversupply
- Strategy: Consider scrapping older, less efficient vessels before newbuilds create surplus
For Port Authorities and Terminal Operators:
- Current demand: Extreme congestion creating urgent need for capacity expansion
- 2027 risk: Newbuild capacity + Suez normalization may reduce port call frequency
- Strategy: Balance expansion investment with demand forecasting; consider dynamic pricing models
Forecast: When Will Normalization Occur?
Based on Sea-Intelligence’s models:
Most Likely Scenario (50-70% probability):
- Congestion begins normalizing: November 2026
- Return to end-2025 levels: January-February 2027
- Full normalization: March-April 2027
- Timeframe: 3-5 months from current date
Aggressive Scenario (20-30% probability):
- Rapid normalization if typhoon season ends abruptly: October 2026
- Return to June 2025 levels: December 2026
- Timeframe: 2-3 months
Pessimistic Scenario (10-20% probability):
- Extended disruption if geopolitical issues compound typhoons: January 2027
- Return to June 2025 levels: June 2027
- Timeframe: 6+ months
Regardless of scenario, the timing of normalization matters enormously. If normalization occurs before Suez fully normalizes and newbuilds accelerate entry, the market can absorb delayed capacity more gradually. If normalization coincides with Suez return and newbuild acceleration, the capacity flood will be simultaneous and devastating to rates.
FAQ: Your Questions About Container Shipping Capacity Shock, Congestion, and 2027 Market Outlook
Q: How much capacity is currently absorbed by port delays? A: Sea-Intelligence estimates 2.3 million teu of global containership capacity is effectively unavailable due to delays. This represents 6.6% of the global fleet and ranks as the world’s sixth-largest carrier equivalent. This capacity is physically available but operationally sidelined in port queues.
Q: Why is port congestion actually helping container shipping? A: By absorbing 2.3 million teu of capacity, delays are artificially throttling supply. This supports vessel utilization and rates. When congestion normalizes, this 2.3 million teu will suddenly re-enter the market, creating a supply surge. Paradoxically, the industry is relying on chaos to prevent oversupply chaos.
Q: What’s the containership orderbook impact? A: The orderbook represents approximately 40% of the existing fleet. These newbuilds will enter service from 2026-2028, adding massive capacity. Combined with delayed capacity releasing and Suez normalization, the industry faces potential overcapacity by 2027.
Q: How does Suez normalization affect capacity? A: When Asia-Europe services shift from Cape routing (14+ days longer) to Suez routing, fewer vessels are needed to maintain equivalent service frequency. A full Suez normalization would create an 8.7% year-on-year contraction in global head-haul teu-mile demand in H1 2027, despite 6.6% underlying demand growth.
Q: What’s the schedule reliability crisis? A: Global schedule reliability fell to 56.4% in July—the sharpest monthly decline since January 2021. This means 43% of scheduled sailings are running late. In Asia, the crisis is worse: Shanghai 21%, Ningbo 34.6%, Singapore 43.2% reliability.
Q: Why is Asia most impacted by the congestion crisis? A: All 14 of Asia’s busiest ports recorded deteriorating reliability in July. Successive typhoons (El Niño intensity among strongest on record) are compounding already-stretched terminal networks. Shanghai’s 21% reliability is particularly catastrophic because it’s the world’s largest container port; delays cascade globally.
Q: When will congestion normalize? A: Sea-Intelligence estimates 2-3.5 months to return to end-2025 levels, or 4.5-6 months to return to June 2025 lows. Most likely normalization timeline: November 2026-January 2027, with full normalization by March-April 2027.
Q: What happens to rates when delayed capacity releases? A: When 2.3 million teu of delayed capacity re-enters service simultaneously with Suez normalization and newbuild entries, the market will experience a supply surge. Rates are likely to compress 20-40% from current levels as carriers blank sailings and compete for volume.
Q: Should shippers negotiate long-term contracts now or wait? A: Most advantages favor waiting until late 2026/early 2027. Rates are likely to decline substantially as capacity releases and newbuilds enter service. Forward contracts now lock in higher rates; negotiating in 2027 should yield 20-30% reductions.
Q: How do the three capacity shocks (delayed capacity, Suez normalization, newbuilds) interact? A: All three occur during 2026-2027. Delayed capacity releases (2-6 months); Suez normalization accelerates (H1 2027); newbuilds enter service (2026-2028). If all three converge simultaneously in Q1 2027, the market will face a capacity flood similar to 2015-2016.
Q: Is container shipping in trouble? A: Yes, from a profitability perspective. Congestion is temporarily masking overcapacity that will become evident when delays normalize. Carriers should prepare for rate compression, reduced sailing frequency, and potential vessel scrapping to manage oversupply.
Source Materials:
- Sea-Intelligence: Container Shipping Schedule Reliability Analysis (July 2026)
- Sea-Intelligence: Fleet Capacity Unavailability Data and Delay Forecasting
- Linerlytica: Containership Capacity Waiting to Berth Analysis (August 2026)
- Sea-Intelligence: Suez Canal Normalization Impact on Teu-Mile Demand
- Regional Schedule Reliability Data: Shanghai, Ningbo, Singapore Port Performance
- Containership Orderbook Analysis: 40% of Existing Fleet
- Drewry: Vessel Waiting Times and Global Port Congestion Trends