CONTAINER SHIPPING MARKET RECOVERY
Second Quarter 2026 Analysis
A Sea-Intelligence Report Analysis
August 28, 2026
Executive Summary
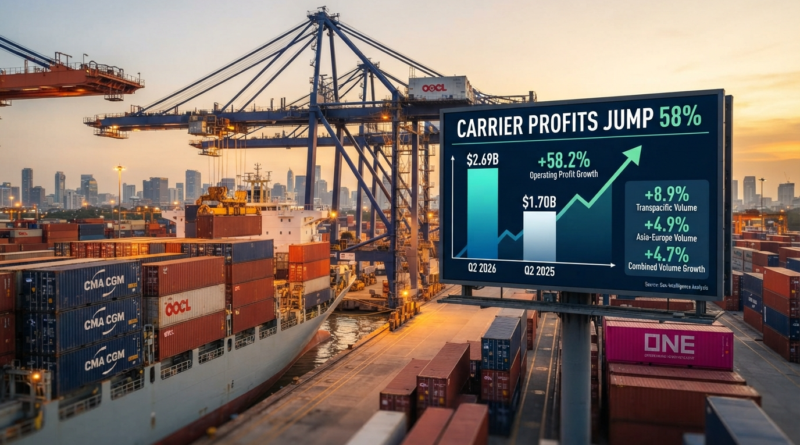
The global container shipping industry experienced a significant financial turnaround in the second quarter of 2026, marking a robust recovery following a challenging 2025. Combined operating profits among eight major container shipping lines surged 58.2% year-on-year, generating USD 2.69 billion in earnings before interest and taxes (EBIT) compared to USD 1.70 billion in Q2 2025.
This report examines the key drivers behind this recovery, analyzes individual carrier performance, evaluates trade lane dynamics, and assesses the market outlook for the remainder of 2026. The data reveals a market no longer in crisis but one marked by volume growth, rate stability, and improved operational conditions that are reversing the downward trajectory of 2025.
Key Findings
1. Profit Surge: Operating profits increased 58.2% YoY, from USD 1.70bn to USD 2.69bn
2. Revenue Growth: Combined carrier revenue rose 15.9% YoY to USD 43.4 billion
3. Volume Expansion: Global container volumes increased 4.7% YoY across reporting carriers
4. Trade Lane Performance: Transpacific volumes +8.9% YoY; Asia-Europe volumes +4.9% YoY
5. Uniform Carrier Growth: All six carriers reporting volume figures recorded positive YoY growth
6. Market Recovery: Data indicates container shipping has regained solid footing after 2025 disruptions
Detailed Financial Performance Analysis
Operating Profit Expansion
The 58.2% year-on-year increase in combined operating profit represents a watershed moment for the container shipping industry. Eight major carriers—representing a significant portion of global capacity—collectively generated USD 2.69 billion in EBIT during Q2 2026, compared to USD 1.70 billion in the same quarter of 2025. This represents an absolute increase of USD 990 million in quarterly operating profits.
This recovery is particularly noteworthy given market conditions at the beginning of 2026, when many analysts projected continued overcapacity and rate pressure. The turnaround reflects improved supply-demand dynamics, better cost management by carriers, and sustained freight rate improvements driven by port congestion and geopolitical disruptions.
Revenue Performance
Combined revenue among reporting shipping lines reached USD 43.4 billion in Q2 2026, representing 15.9% growth compared to USD 37.5 billion in Q2 2025. This revenue expansion reflects two principal drivers:
• Volume Growth: Global container volumes increased 4.7% year-on-year, indicating sustained demand for containerized trade across major markets.
• Freight Rate Improvements: Spot rates and contract rates showed material improvement during Q2, driven by balanced supply-demand dynamics and persistent supply chain congestion.
Individual carriers reported varying rate performance. Maersk, the industry’s second-largest carrier by volume, reported average freight rate increases of 22% in its ocean business, while managing a 4.1% volume increase. CMA CGM, Europe’s largest shipping line, posted 19.2% revenue growth and 31% EBITDA growth, supported by stronger freight rates and volumes. These results demonstrate that despite industry-wide overcapacity concerns at the beginning of 2026, carriers were able to improve yields through network management and selective capacity deployment.
Carrier Performance and Market Share
Volume Growth Leaders
Among carriers reporting Q2 volume figures, performance varied significantly:
| Carrier | Volume Growth (YoY) | Global Position |
| OOCL | 8.8% | Strongest among reporters |
| CMA CGM | 6.0% | Second highest volume growth |
| Ocean Network Express (ONE) | 2.9% | Lowest among reporters |
| Reporting Carriers (Combined) | 4.7% | Aggregate growth rate |
OOCL’s 8.8% volume growth demonstrates strong market capture in Asia-Pacific corridors and reflects operational strengths in regional gateway ports. CMA CGM’s 6.0% growth, coupled with its 31% EBITDA improvement, suggests successful execution of strategic rate management and volume commitments. Ocean Network Express’s more modest 2.9% volume growth, while positive, reflects its positioning as a more contract-focused carrier with potentially lower exposure to spot market upside.
Maersk’s Strong Profit Upside
Maersk, the world’s second-largest container shipping line, delivered exceptional Q2 2026 results that exceeded market expectations. The Danish carrier reported:
• Revenue: USD 15.8 billion, up 20% YoY (Ocean business up 23% to USD 10.5 billion)
• EBITDA: USD 3.0 billion, up 30% YoY (19.0% margin)
• EBIT (Operating Profit): USD 1.6 billion, up 86% YoY (10.0% margin)
• Ocean Segment EBIT: USD 935 million, versus USD 229 million in Q2 2025 (308% increase)
The standout figure is the 86% increase in operating profit, driven by a 22% improvement in average freight rates combined with 4.1% volume growth. This performance substantially outpaced the broader industry 58.2% profit increase, reflecting Maersk’s market leadership and pricing power in key corridors, particularly on transpacific routes where it commands significant market share.
Maersk subsequently raised its full-year 2026 guidance for underlying EBIT to USD 4.5–6.5 billion, up from a previous USD 2.0–4.0 billion forecast—a substantial 125% mid-point upgrade. This revision signals management confidence in sustained demand momentum and signals an expectation of continued rate stability or improvement through Q3 and Q4 2026.
Trade Lane and Regional Performance
Transpacific Trade Route Strength
Transpacific volumes recorded the strongest performance among major trade lanes, growing 8.9% year-on-year in Q2 2026. This double-digit growth rate significantly exceeded the global average of 4.7%, reflecting:
• Sustained Chinese export competitiveness, with Asian exports serving as the primary volume engine
• Strong import demand in North America, driven by inventory replenishment cycles and e-commerce
• Recovery of U.S. East Coast imports, which showed double-digit throughput growth as shippers diversified routing strategies
Asia-Europe Trade Performance
Asia-Europe volumes, representing the industry’s second-largest trade corridor by volume, grew 4.9% year-on-year. While this rate trails transpacific growth, it represents meaningful recovery given the persistent Red Sea disruptions that continue to affect this route. Key considerations:
• Most carriers continue to default to Cape of Good Hope routing, adding approximately 4–6 days to transit times and consuming incremental vessel capacity
• Suez Canal transit remains selective and limited, with carriers like Maersk conducting successful test transits but maintaining cautious deployment strategies
• The longer voyage distances have temporarily absorbed excess tonnage, supporting rate integrity despite the industry’s newbuild delivery cycle
Regional Import Dynamics
Maersk’s earnings call highlighted notable regional variations in Q2 2026 import flows:
• Africa, North America, and Latin America: Particularly strong import demand, driven by sustained Far East exports
• Middle East: Imports collapsed by approximately 40% YoY due to ongoing geopolitical disruptions; partial recovery through alternative routing (inland transshipment) partially offset direct losses
These regional patterns underscore the bifurcated nature of global trade in 2026: strong in some regions (North America, Africa) and constrained in others (Middle East), creating portfolio effects for carriers with diversified geographic exposures.
Key Market Drivers and Support Factors
The container shipping recovery in Q2 2026 was supported by several structural and cyclical factors:
1. Demand Recovery and Trade Normalization
After a challenging 2025 marked by overcapacity and rate pressure, global trade volumes rebounded in the first half of 2026. E-commerce restocking cycles, particularly in North America, and sustained consumer spending in developed markets created incremental container demand. Chinese exports maintained momentum, with Asian exports serving as the primary volume engine for carriers.
2. Port Congestion and Schedule Reliability
Global port congestion—particularly in European and Middle Eastern gateways—persisted in Q2 2026 despite the end of many 2024–2025 disruptions. This congestion supported freight rates by constraining effective capacity and extending vessel turnaround times. Schedule reliability improved to 62.2% in March 2026 (the latest data point available), up 5.2 percentage points year-on-year, suggesting a gradual stabilization that nonetheless remained below historical norms.
3. Geopolitical Disruptions and Route Diversions
The unresolved Red Sea security situation and persistent Strait of Hormuz tensions maintained heightened shipping route complexity. Forced diversions to the Cape of Good Hope for Asia-Europe services added 4–6 days to transit times and consumed incremental vessel capacity, functioning as a temporary capacity support mechanism. Similarly, Middle East import disruptions drove alternative routing through overland transshipment solutions, creating less efficient but still necessary capacity utilization.
4. Newbuild Delivery Absorption
The container shipping industry experienced its largest fleet expansion since the 2008–2011 boom cycle, with record newbuild vessel deliveries throughout 2025 and into 2026. These deliveries—including larger, more efficient ships from new generation classes—were deployed onto routes and corridors experiencing the strongest demand growth (transpacific, select Asia-Europe services), supporting volume expansion without triggering capacity gluts on secondary routes.
5. Carrier Capacity Management
Carriers continue to use blank sailings (cancelled voyages) and slow-steaming strategies to manage overcapacity on secondary and tertiary routes. While these tools constrain volume upside on weaker corridors, they prevent rate collapse and support margin integrity. Q2 data showing positive volume growth across all reporting carriers despite ongoing capacity additions reflects the efficacy of these management techniques.
Market Outlook and Forward Indicators
Volume Trajectory
Industry consensus expects global container volumes to grow approximately 4% throughout 2026. Maersk’s guidance, issued after the strong Q2 results, explicitly assumes 4% annual growth. This would represent modest but stable expansion—well below pandemic-era peaks and early-cycle recoveries, but substantially above the negative growth or flat performance seen in 2025.
Q3 typically represents peak shipping season in the northern hemisphere, and carriers are positioned to capture this seasonal strength. Maersk management specifically noted that “this strength may extend into the third quarter of 2026, as exports from China show no signs of abating.” This commentary suggests carrier optimism for H2 2026 performance.
Freight Rate Environment
Spot rates are expected to exhibit seasonal volatility. Industry analysts forecast:
• Q2–Q3 2026: Moderate upward pressure during peak season, with spot increases of 10–20% expected on transpacific lanes
• Q4 2026: Rate pressure dependent on inventory restocking cycles; carriers may implement selective capacity management (blank sailings) if demand weakens
The Drewry World Container Index, which fell to USD 2,107 per FEU in late January 2026, would need to remain above USD 2,000–2,200 for carriers to maintain profitability at current cost structures. Q2 improvements in negotiated contract rates—reported by Maersk as 22% higher and by CMA CGM at elevated levels—suggest strong carrier negotiating positions heading into H2 contract renewals.
Profitability Outlook
The major carriers’ profit guidance upgrades signal confidence in 2026 full-year performance. Operating margins have recovered from depressed levels in 2025 (when many carriers reported single-digit or negative margins) to more sustainable 10–20% ranges:
• Maersk: Targeting EBIT margins of 10%+ based on Q2 results and guidance
• CMA CGM: Achieved 19.1% EBITDA margin in Q2 2026, indicating strong operating leverage
• Industry Average: Operating margins of 15–25% for major carriers (versus 50%+ in 2022 peak)
This represents a normalized profitability environment—above distressed levels but well below pandemic-era peaks. The durability of these margins depends on sustaining current volume growth rates, preventing rate collapse, and managing the ongoing newbuild delivery cycle without triggering overcapacity on major routes.
Risk Factors
Several risks could disrupt the current recovery trajectory:
• Red Sea Resolution: Rapid normalization of Red Sea transit would reduce the Cape routing premium and compress Asia-Europe freight rates by 10–20%
• Demand Weakness: Weaker-than-expected import demand in Q4 2026 could trigger carrier capacity cuts and rate pressure
• Fleet Overcapacity: Continued newbuild deliveries in 2027–2028 could oversupply major routes if demand growth slows
• Tariff/Trade Policy: U.S. or EU tariff escalation could reduce import demand and impact transpacific growth trajectory
Implications for Shippers and Supply Chain Managers
Improved Shipper Negotiating Leverage
Despite carriers’ improved profitability, shippers have gained meaningful negotiating leverage due to record newbuild deliveries and the container fleet’s largest expansion since 2008–2011. The ratio of available capacity to transported demand has shifted in shippers’ favor. Key implications:
• Carriers are more willing to negotiate volume commitments and rate bands, particularly for long-term contracts
• Spot rate flexibility remains available, though peak season (Q3) may see 10–20% premiums on transpacific routes
• Service level agreements (SLAs) and equipment guarantees are increasingly negotiable within long-term contract terms
Route Diversification and Geopolitical Risk
Persistent Red Sea and Strait of Hormuz disruptions necessitate continued supply chain resilience planning:
• Asia-Europe shippers should maintain contingency plans for both Cape and Suez routing, monitoring cost differentials (currently 4–6 days and 5–10% rate premiums for Cape routing)
• Middle East import plans should budget for extended transit times and consider alternative sourcing or routing strategies
• Shippers should diversify carriers across multiple alliances to maintain routing flexibility and avoid single-carrier dependencies
Contract Negotiation Timing
The Q2 2026 recovery has improved carrier financial positions materially, supporting stronger negotiating stances. Shippers planning major contract renewals should consider:
• Earlier engagement with carriers to lock rates before Q4 peak season demand
• Multi-year contract structures (3–5 years) to stabilize costs across carrier cycle variations
• Hybrid spot/contract strategies that maintain flexibility while anchoring cost floors
Conclusion
The container shipping industry’s Q2 2026 recovery represents a significant inflection point from the challenging conditions of 2025. The 58.2% increase in combined operating profit, coupled with 15.9% revenue growth and 4.7% volume expansion across reporting carriers, signals a market that has stabilized and begun to normalize.
This recovery has been supported by:
✓ Sustained global trade demand, particularly from China and into North American and African markets
✓ Port congestion and schedule reliability challenges that support freight rate levels
✓ Geopolitical disruptions that maintain elevated route complexity and consume incremental capacity
✓ Effective carrier capacity management through blank sailings and selective deployment strategies
Looking forward, the industry’s 4% expected volume growth for full-year 2026, combined with carrier confidence in sustained demand (as evidenced by Maersk’s guidance increase), suggests that container shipping has successfully transitioned from crisis management to normalized operations. Operating margins in the 10–20% range represent a sustainable equilibrium well above distressed levels but significantly below pandemic-era peaks.
However, several structural risks remain: the record newbuild delivery cycle may overwhelm capacity management efforts; Red Sea normalization could compress Asia-Europe rates; and macroeconomic headwinds could reduce Q4 2026 demand. Carriers and shippers alike should remain vigilant to these risks while capitalizing on the current profitability window to strengthen balance sheets and invest in operational resilience.
For shippers, the recovered market presents opportunities for improved contract negotiations, route diversification, and supply chain optimization—but demands continued engagement with market dynamics and disciplined risk management.
Data Sources
This report is based on:
• Sea-Intelligence Q2 2026 Carrier Financial Analysis
• Freight News (August 28, 2026): “Carrier Profits Jump 58%”
• Maersk Q2 2026 Earnings Report and Guidance (August 13, 2026)
• CMA CGM Q2 2026 Financial Performance
• Sea-Intelligence Global Liner Performance Reports (March–August 2026)
• Industry forecasting and analysis from Container News, World Cargo News, and Global Maritime Hub
Report Date: August 28, 2026